SampleManager LIMS Matrix Components


Thermo Fisher Scientific’s SampleManager LIMS™ offers an extensive array of features and capabilities that can benefit your organization. SampleManager’s open architecture provides the tools necessary to transform isolated laboratory data siloes into a connected, global knowledge base that can be viewed and shared across the wider organization, from R&D to manufacturing.
SampleManager LIMS provides instrument integration functionality that serves to streamline lab processes and eliminate manual steps related to sample testing and results capture and analysis. One little-used tool that helps users save time when performing analyses in SampleManager is Matrix Components. In this article, we will discuss how to setup and use Matrix Components and how they can be leveraged to improve efficiency in your laboratory environment.
Matrix Components
Most SampleManager users know the importance of analysis components and how they translate to tests during result entry. One aspect of analyses which is often overlooked, however, is the use of the Analysis – Matrix Components. Matrix Components provide for a one to many relationship allowing the user to enter multiple result values for a single component in a matrix/spreadsheet format. This can be handy when a set of components have a common set of characteristics and can save the user time at result entry. For example, you could leverage a matrix component when you you need to analyze a set of standards at different wavelengths for a performance verification analysis.
To setup an Matrix Component when defining the Analysis, navigate to the “Matrix Components” tab and select the “Add Matrix” button in the middle of the screen.
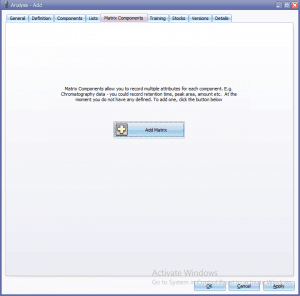
Figure 1: The Add Matrix>Matrix Components tab
The “Analysis – Matrix Components” page opens showing the matrix definition controls.
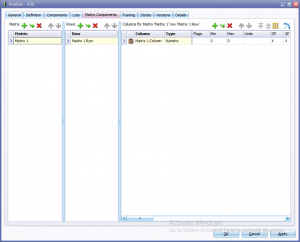
Figure 2: Matrix Components page
- Left List – shows all matrices defined for the analysis
- Middle List – shows rows defined for the current matrix
- Right Grid – shows columns defined for the current row. Note: All rows in a matrix will have all columns applied to each, and each row will retain the same column name and type. Howeverother component properties, such as units, can be different for each row.
Building The Matrix
Steps for building a matrix:
- To add a new Matrix – click on the little green ‘Add’ (+) button above the Left List. Note: when you first create a matrix, this list will automatically be populated with a ‘Matrix 1’ entry. No need to add another one, just change the name to one more sutiable for your needs.
- To add a new row, click on the little green ‘Add’ (+) button above the Middle List. A new row appears. Rename the row to one more sutiable for your needs.
- Repeat step 2 until all your rows are defined as needed.
- To add a new column/component, click on the little green ‘Add’ (+) button above the Right Grid. A new component appears. Set the properties for the component (e.g., ‘Name’, ‘Type’, ‘Flags’, ‘Units’, etc.). Note: the same functionality used in creating a typical analysis component is available to you here.
- Repeat step 3 until you have all your columns/components defined. Ensure that you define your properties for each row/column combination, except for the name and type which remain consistant, as mentioned above.
- Save by selecting the ‘OK’ or the ‘Apply’ button
When you are done you should have a Matrix Grid similar to one shown below.
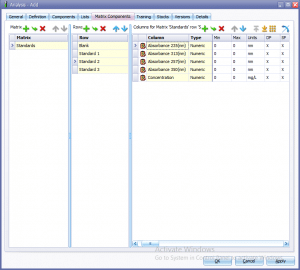
Figure 3: Example of completed Matrix Grid
Add Matrix to Component List:
- If using ‘Component Lists’ then add the Matrix Components to an existing list or create a new one as needed. Note: if creating multiple matrices in an analysis which use the same column names, the component list can become very busy and you can inadvertantly select the wrong component to a list. So make sure to pay close attention to which components you are selecting.
- Save by selecting the ‘OK’ or the ‘Apply’ button.
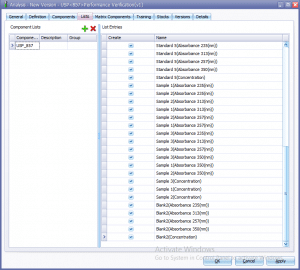
Figure 4: Adding Matrix Components to a Component List Matrix Grid
Matrix Row Naming Convention
When adding a new matrix on an analysis that already contains one, you must ensure that any new row(s) do not contain the same name as that of a row in another matrix (i.e. Row names must be unique!). Otherwise, an error will be generated when trying to save. On the other hand, columns can have the same names across multiple matrices, and the system will prevent you from creating 2 matrices with the same name. You just can’t have the same row name in two different matrices in an analysis.
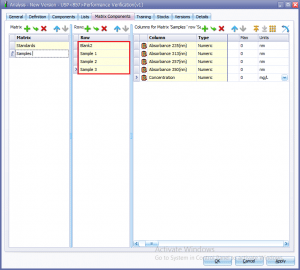
Figure 5: Row names in additional matrices must be unique
Result Entry Screen
Now that we’ve seen how to build the Matrix, lets take a look at what the user is presented with at result entry. Matrix components are identified as analysis components having a Type of ‘M’ in the result entry screen.
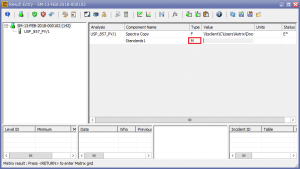
Figure 6: Result Entry Screen showing a Matrix Component – Component of Type ‘M’
To access the Matrix Grid you must double click in the ‘Value’ field for the matrix component. The Matrix Component – Result Entry screen opens.
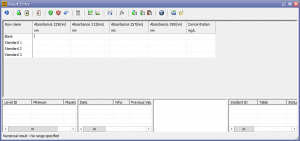
Figure 7: The Matrix Component – Result Entry screen
The user has the same functionality as in a typical result entry screen except the value entries are laid out in a grid. Key board short cuts such as CTRL+ DOWN can be used to quickly enter up, down or across the grid. This can come in useful when adding multiple entries of the same type such as a ‘Time of Analysis’ value.
The more important feature is that each row can have multiple attributes whereas in the typical result entry screen it’s a 1 to 1 relationship. This methodology can easily be utilized for analysis such as Chromatography , or a myriad of other laboratory analyses – its really up to the user and their particular situation.
One of the great benefits of the result entry screen is its usability. Oftentimes lab users are accustomed to working in a spreadsheet centric environment, and when transitioning to a LIMS they will look for spreadsheet like features. The SampleManager matrix result entry screen provides this functionality out-of-the-box, without the need for any expensive and time-consuming customizations.
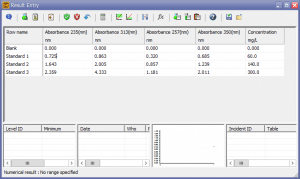
Figure 8: Result Entry for a Matrix
Conclusion
The Astrix Team contains some of the most knowledgeable SampleManager experts in the world. In this article, we’ve gone over the setup and usage of Matrix Components and how they can be leveraged to save time and improve LIMS usability in the lab.
Our Team has extensive experience working on SampleManager implementations across numerous industries, and brings together the technical, strategic and content knowledge necessary to effectively implement SampleManager LIMS™ into your organization. If you would like to explore other aspects of analyses in SampleManager, or any of the other out-of-the-box features that are available in SampleManager which could help improve the efficiency of your laboratory, do not hesitate to contact us for a no obligations consultation.
Astrix is a full-service informatics consulting and staffing firm that has been serving the scientific community since 1995. We specialize in laboratory informatics strategic planning, vendor selection, development, implementation, integration, managed services and scientific staffing. Astrix professionals have the skills and expertise necessary to architect, implement, integrate and support best in class solutions for your organization’s laboratory environment.
Case Study: LabWare Centralized Data Review for a Global Biopharmaceutical Company
Overview A global biopharmaceutical company specializing in discovery, development,... LEARN MOREWhite Paper: Managing Data Integrity in FDA-Regulated labs.
New White Paper LEARN MORELET´S GET STARTED
Contact us today and let’s begin working on a solution for your most complex strategy, technology and staffing challenges.
CONTACT US