
Introduction to Pharmaceutical Data Items and Their Structure
Structuring the data used in pharmaceutical reporting will reduce the time needed to create reports, eliminate the manual (human) verification of data tables, and ensure error-free submissions. The use of structured data is particularly powerful in Module 3, which includes large, complex sets of data related to product quality. Using a structured approach to data from source to submission improves data integrity, follows ALCOA+, and is a foundation for working towards the ISPE Pharma 4.0™️ initiative[i].
Throughout the CGMP data life cycle, CDER and CBER stress the importance of data integrity. “…data integrity refers to the completeness, consistency, and accuracy of data. Complete, consistent, and accurate data should be attributable, legible, contemporaneously recorded, original or a true copy, and accurate (ALCOA). Data integrity is critical throughout the CGMP data life cycle, including in the creation, modification, processing, maintenance, archival, retrieval, transmission, and disposition of data after the record’s retention period ends. System design and controls should enable easy detection of errors, omissions, and aberrant results throughout the data’s life cycle.”[ii]
With internal structure, each data item is unique, related to other data items, and can be part of an overall taxonomy or ontology[iii]. A structured data item can be reused in many places and still be a single item. If something about the item changes, the change will be seen “everywhere” because it is a single, unique data item used in more than one location.
Overview
In this first article of the series, we use the example of drug stability reporting to consider problems with a lack of internal structure at the data item level and how structure can reduce or eliminate those problems. As part of the analytical development domain of Chemistry, Manufacturing, and Controls (CMC), stability testing generates large data sets that are used in complex data tables. CMC reports, including stability, are included in Module 3 (Fig. 1) of the Common Technical Document (CTD)[iv].
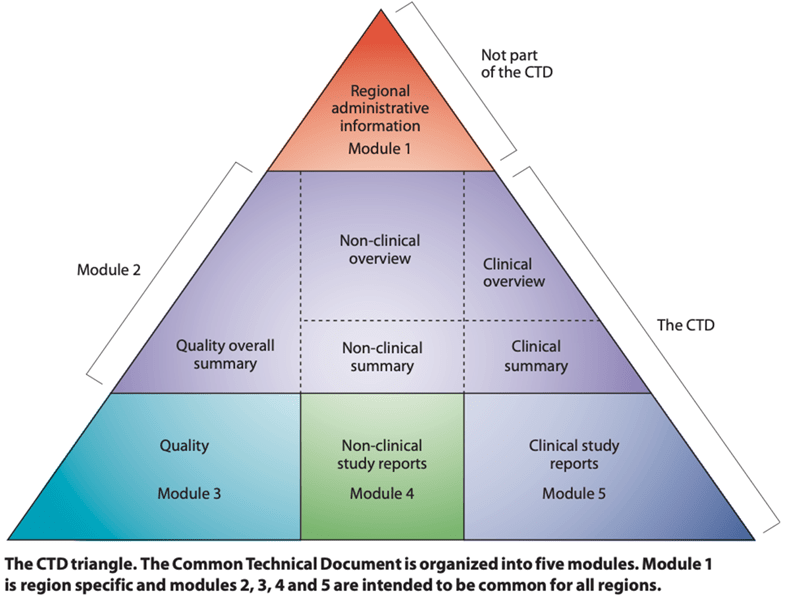 Figure 1: The Common Technical Document (CTD)
CMC is responsible for assuring the product sold will have quality attributes similar to those of the product demonstrated to be safe and effective and that the product quality is consistent and meets appropriate standards. A key outcome of CMC work is the confidence that the drug described on a label is exactly the drug used by a patient.
Critical CMC Elements:
- Testing of raw materials
- Where/how the product is manufactured
- Monitoring relevant test methods for quality
- Product quality and consistency (and their controls)
- Identify/manage product quality attributes
- The shelf life of the product
Drug Stability Testing
Pharmaceutical products, both large molecule and small molecule, require many types of testing to demonstrate their safety, efficacy, and overall quality. One type of testing is for drug stability. This testing is essential because it is used to define the storage conditions and shelf life of a product. Drug stability testing generates large, complex data sets that are time-consuming to generate, tedious to verify, and prone to errors.
Stability is defined as the extent to which a product retains, within specified limits, and throughout its period of storage and use (i.e., its shelf life), the same properties and characteristics that it possessed at the time of its manufacture.[i]
The International Council for Harmonization of Technical Requirements for Pharmaceuticals for Human Use (ICH) has established guidelines for drug stability testing. Guideline Q1A(R2), Stability Testing of New Drug Substances and Products, outlines the requirements for stability testing during the product development process, including the design of stability studies, the selection of appropriate test conditions, and the establishment of shelf life and storage conditions. “The purpose of stability testing is to provide evidence on how the quality of a drug substance or drug product varies with time under the influence of a variety of environmental factors, such as temperature, humidity, and light, and to establish a retest period for the drug substance or a shelf life for the drug product and recommended storage conditions.”[ii]
Stability testing is conducted in preclinical, clinical, and technology transfer/commercialization stages (as well as annually, once a product is commercialized) to establish and maintain an accurate assessment of the product. Data is used to document and demonstrate the product’s overall stability profile. The goal of stability testing is to monitor any changes in properties over time under various environmental conditions, such as temperature, humidity, and light exposure.
Testing for stability generates large data sets. Consider the example of a drug that is to be produced in two strengths and three batches for each strength. The drug will be packaged in three different container types. Samples are taken for each combination and then stored for testing over a period of time. The samples are stored under specified storage conditions and several tests are performed on each sample at designated time points. This testing can result in ~20,000 data points for a stability report (Fig. 2). These results must be entered into carefully controlled and formatted data tables which must be verified, approved, and released for both internal reports and formal submissions.
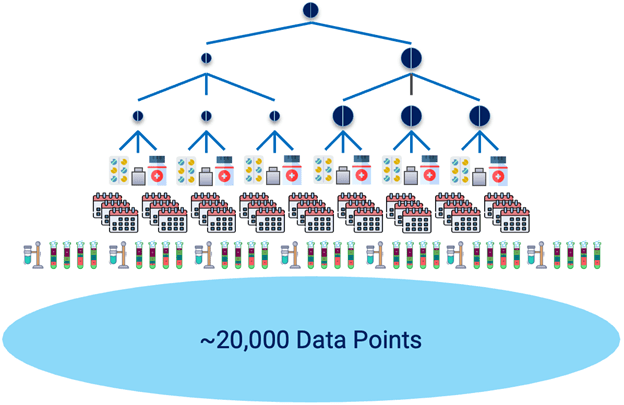
Figure 2: Stability testing generates large data sets
The complete drug stability report for the product includes more than large data tables. It may also include narrative content, prose, statistical analysis, and graphics. All parts of the report are time-consuming to create but it is the heavy lifting of the large, complex data tables that drives the significant resource requirements to successfully complete such work for CMC and regulatory teams.
Many organizations have excellent tools in their R&D facilities, laboratories, and manufacturing plants. They also have well-documented quality and business processes. All of this helps generate large amounts of valuable data. However, many companies still rely on humans to transcribe, aggregate, and format the data for use in the critical documents and reports required for submission to health authorities. For many CMC reports, especially drug stability, the manual creation of large data tables entails errors.
Critical Quality Attributes
Many pharmaceutical companies are good at storing data but are challenged to use that data to solve complex Critical Quality Attribute (CQA) problems. Data is not always well-structured to support technology transfer, filings, and annual reporting. The process of moving data from source systems to submission is a major burden on CMC and often consumes 15-20% of FTE time (transcribing, aggregating, analyzing, and reporting). CMC costs increase even higher with the extra work caused by manual data verification, error correction, and resubmission efforts. Many people, using many tools, “touch” data in an uncontrolled fashion which reduces credibility with health authorities (Fig 3). The continuous looping through people and tools adds time and the opportunity for error.

Figure 3: Many people, using many tools, leads to questionable results
In many cases, a single piece of data is used in multiple locations. A quality attribute defined in a Specification Document may be used in a Justification Of Specifications report or in a Criticality Analysis worksheet. Copying and pasting data between different tools is dangerous because each copy is now its own independent entity. Traceability is nearly impossible since it requires a manual, or visual, inspection to confirm exactly “what is connected to what” and that a change to an item in one location is also changed on the item in all of the other locations where is it used (Fig. 4). This unstructured approach is ripe for errors and omissions. Pharmaceutical scientists should be spending time doing science, but they end up spending significant time organizing, finding, changing, tracing, and verifying data for critical CMC reports.
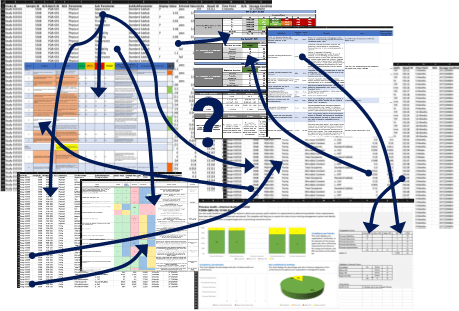
Figure 4: What a tangled web is woven with unstructured approaches to CMC data
Reducing Errors in CMC Reporting
Errors in Module 3 reports cause delays in filings. A recent filing was submitted to a health authority with ~140 errors in Section 3.2 tabulated data. The stability data was incorrectly reported to the health authority. There were more than 75 transcription errors for real time, stressed, and accelerated testing found in 3.2.S.7.3 and 3.2.P.8.3. These errors occurred during transcription of data points from source (LIMS) to the spreadsheets used by the CMC team. The result was a delay of more than 45 days, with significant lost revenues for the product.
There is inherent risk in the manual transcription of 20,000 data points and the manual creation of data tables using unstructured data approaches. Even with strong procedural controls for manual data verification, the sheer volume of data handled causes problems. Such errors bring into question the overall data integrity of the program and reduce credibility with health authorities. Credibility is hard to earn and easy to lose.
Similar problems occur with other unstructured analytical reports. For example, a Batch Analysis report may have 4,500 data points, manually entered into MS Excel™️. It is common to find 110-115 data errors (~2.5%), dozens of transcription errors, and multiple calculation errors. Again and again, the same underlying causes are responsible for errors:
- 100% manual data entry
- No data locks
- Manual (often visual!) data verification
- Manual calculations
- Manual data formatting
- Manual fix of errors (resulting in more manual verification)
To reduce errors in CMC reports, we must reduce manual data touches. Better yet, we should eliminate manual data touches altogether from the entire process. Automating the process of moving data from source systems to submission, while adhering to a standardized convention for naming, taxonomies, ontologies, and data item internal structure will reduce the overall resource needs to generate reports, reduce the time for data verification, and eliminate data errors. Use a structured data approach to automate the creation of all data tables.
Structuring Individual Data Items
The definition of the phrase “structured data” can vary based on the audience and use scenarios. In pharmaceutical data science, structured data is often associated with following a standardized taxonomy or ontology to ensure consistency across all platforms and uses. Groups like the Allotrope Foundation[i] and others work to standardize ontologies within and across industries. For this article, we consider structure in the fundamental sense of how an individual item is internally organized; we define a data item along with its attributes and connections. Additional articles in this series discuss moving from the individual data item to sets of data items, data transcription and aggregation, and automating the creation of complex data tables for electronic pharmaceutical reports.
A data item with internal structure is not simply an “entry or row in MS Excel™️.” It is a unique entity that exists with a set of attributes. It exists over time and tracks who uses it if it can be changed, and who approves it. A data item can connect with other data items for dynamic links, which can be traced and displayed to the user. It may exist in many locations while still being a single data item. If something about the item changes, the change is seen everywhere that the data item is used. It is a single data item being used in multiple locations (Fig. 5). These different locations may be data tables, prose sections of reports (where the data item is automatically inserted), projects, and traces.
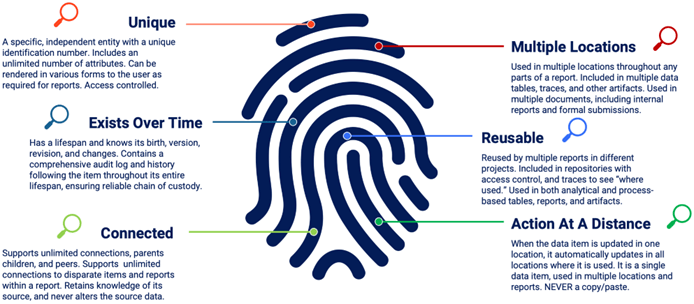
Figure 5: Definition of structure in a data item
This approach to structuring individual data items creates a strong foundation for data science initiatives in both formal and informal reporting for all modules of the CTD. It provides the flexibility to use data in multiple formats and reports while ensuring data integrity and a trustworthy chain of custody throughout the life span of every data item. Most data items have a life span of years and using this approach to structure will support the many ways in which data is consumed, including in fully-structured online filings to health authorities.
Structured Data Approach Example: Purity Analysis
Using stability again as an example, this structured approach is easily understood. Teams conduct studies to perform analysis on many analyses, or parameters, over time (the word “parameter” is used here as a general way to describe what is being tested). Each test result includes many required entries. In this very simplified example (Fig. 6), there are two measurements conducted for Microbial Content, which itself is part of the overall Purity: C. difficile and E. coli. To structure this data, it must be organized in a meaningful way that can be used for reporting and other uses. Having the measurement data in rows like MS Excel™️ is not structured and leads to the problems discussed earlier. The most useful, and powerful, way to create structure at this level is to use the analysis and measurements as the foundational data items leading to structured electronic reporting.

Figure 6: (simplified) Example of stability testing data
Purity is an analysis. It is not directly tested with a single measurement. Instead, it is broken down into groups of measurements, the results of which all contribute to the overall purity. There is variation in industry nomenclature; don’t let the words get in the way of the structure and organization of the stability data.
Purity (analysis)
Microbial Content
- difficile (measurement)
- coli (measurement)
Physical (analysis)
Appearance (measurement)
Size (measurement)
Friability (measurement)
All measurements (test results) for an analysis include more detail than just the actual results. For example, they are associated with a particular sample, held under certain storage conditions, coming from a particular manufacturing site, and were tested at a certain time point. All of this information will become attributes on the structured data item (Fig. 7).
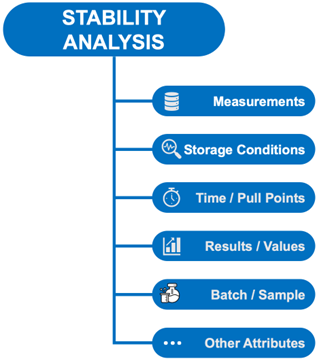
Figure 7: Structure of a Stability Parameter
Using this approach, the Purity data item contains all of the attributes needed to render it useful and reliable for reporting. The same is true for every other analysis, and measurement, in a stability study. The results from testing are included with Purity in its attributes. They are captured as entered during the study. They are secure because Purity is an internally structured data item with access control, an audit log, and a complete chain of custody to ensure data integrity.
As a structured data item, Purity can be told to render its attributes at different locations in different formats. For example, a particular report may call for reporting any Microbial Content result that is less than or equal to .5 as “≤.5.” The actual measurement results in our example from Figure 6 have values of .45 and .3, which are never changed (no altering of source data!) An internally structured data system allows the user to designate that, for a certain report, any Microbial Content result of less than or equal to .5 must be displayed as ≤.5 (Fig. 8, 9). It is a simple setting that can “stick” for a report while not altering the actual entered value for the measurement.

Figure 8: Setting a display value for a measurement in a structured data system
(from Cognition Corporation’s Drug Stability Reporting Application)
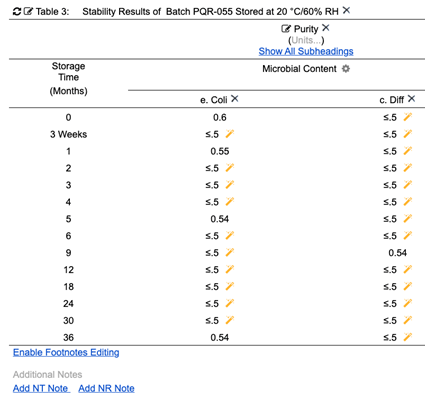
Figure 9: Stability table displays formatted values as required without changing source values
(from Cognition Corporation’s Drug Stability Reporting Application)
Microbial Content measurements may display with different formats in different reports as needed. The source value is always retained by the structured data item. Any report can reset the display values of Microbial Content back to the original at any time. Although all values in the above stability table that are less than .5 are displayed as ≤.5, changing that display setting will remove the formatting and display the original entered values (Fig. 10, 11). This is just some of the power of using internally structured data items for pharmaceutical reporting.

Figure 10: Set formatting back to default to display original (source) data value
(from Cognition Corporation’s Drug Stability Reporting Application)
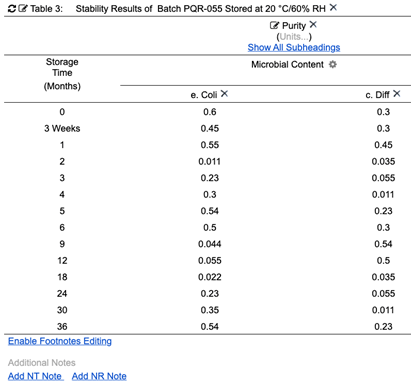
Figure 11: Stability table displays original (source) data values
(from Cognition Corporation’s Drug Stability Reporting Application)
A system using internally structured data items also supports dynamic stability, and other, reports. For example, the system may import initial source data from LIMS or some other system. The source data (Fig. 12) may have a certain number of Time Points and may be missing measurement data.
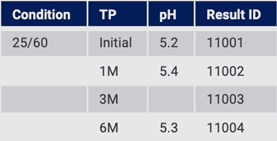
Figure 12: Initial stability testing values in source system
On import, all data is created in the structured system. The system detects missing values and can add NT, NR (Fig. 13), or some other entry to flag that there is missing data.
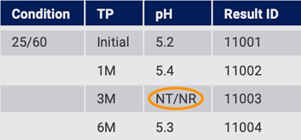
Figure 13: Structured system flags missing data
At a later point in time, the source data is updated. There may be a change to a previous value, missing data filled in, and new Time Points added (Fig. 14). This is common behavior as stability testing continues over sometimes long periods of time.
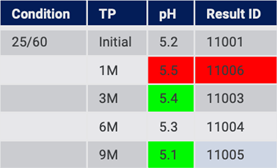
Figure 14: Source system has changed since previous import
The structured system can interrogate the source system and perform another import. At this point, the structured system detects the changed value for 1 Month, the value that was previously missing for 3 Months, and the new value for 9 Months (Fig. 15).
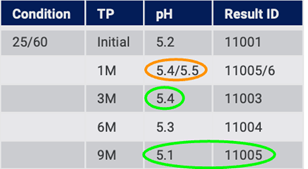
Figure 15: Structured system detects, and handles, changes over time from source data
The structured system can be adjusted to handle such an update based on the needs of the project at any particular time. For example, the system may flag that at 3 Months, there was an original value from the source and now a new value. Both values can be retained and the user can decide which value to use in a data table report. The structured system can add the value for 3 Months that was previously missing. It can also add the new Time Point for 9 Months.
The structured system handles new, or changing, source data by either merging or overwriting as the source updates. This is important because stability reports need to be dynamic and update over time.
Summary
This article has covered some of the basics of using internally structured data for stability reporting. The power is evident with the ability to manage and render data in various ways, over a period of time, while not altering source data. This fundamental aspect of internally structured data is what gives it the power to handle all types of pharmaceutical reporting, both analytical and process. In the next article, we will look at some similarities and differences between pharmaceutical and medical device data and how the pharmaceutical industry can take advantage of work done by the device industry using this approach to internally structured data.
About Cognition
Cognition Corporation, headquartered in Lexington, Massachusetts, develops, sells, and supports product development and compliance solutions for the life sciences industry. Its Software-as-a-Service solutions help meet regulations faster with real-time traceability, guided design controls, and change once, update everywhere functionality – turning manual and disconnected data into streamlined, structured submissions that enable them to get to market faster.
About Astrix
Astrix is the unrivaled market leader in creating & delivering innovative strategies, technology solutions, and people to the life science community. Through world-class people, process, and technology, Astrix works with clients to fundamentally improve business, scientific, and medical outcomes and the quality of life everywhere. Founded by scientists to solve the unique challenges of the life science community, Astrix offers a growing array of fully integrated services designed to deliver value to clients across their organizations. To learn the latest about how Astrix is transforming the way science-based businesses succeed today, visit www.astrixinc.com.
References
[1] ISPE Pharma 4.0 Accessed 1 September, 2023
https://ispe.org/initiatives/pharma-4.0
[2] FDA Data Integrity and Compliance With Drug CGMP December, 2018
https://www.fda.gov/media/119267/download
[3] Allotrope Foundation Allotrope Framework Accessed September 1, 2023
https://www.allotrope.org/allotrope-framework
[4] FDA Guidance for Industry M4Q: The CTD – Quality August, 2001
https://www.fda.gov/media/71581/download
[5] USP Stability Considerations in Dispensing Practice (1191) Accessed 1 September, 2023
http://www.uspbpep.com/usp32/pub/data/v32270/usp32nf27s0_c1191.html
[6] ICH STABILITY TESTING OF NEW DRUG SUBSTANCES AND PRODUCTS Q1A(R2): 1.3
6 February, 2003
https://database.ich.org/sites/default/files/Q1A%28R2%29%20Guideline.pdf
[7] Allotrope Foundation Accessed 1 September, 2023
Related
Case Study: LabWare Centralized Data Review for a Global Biopharmaceutical Company
Overview A global biopharmaceutical company specializing in discovery, development,... LEARN MOREWhite Paper: Managing Data Integrity in FDA-Regulated labs.
New White Paper LEARN MORELET´S GET STARTED
Contact us today and let’s begin working on a solution for your most complex strategy, technology and staffing challenges.
CONTACT US


